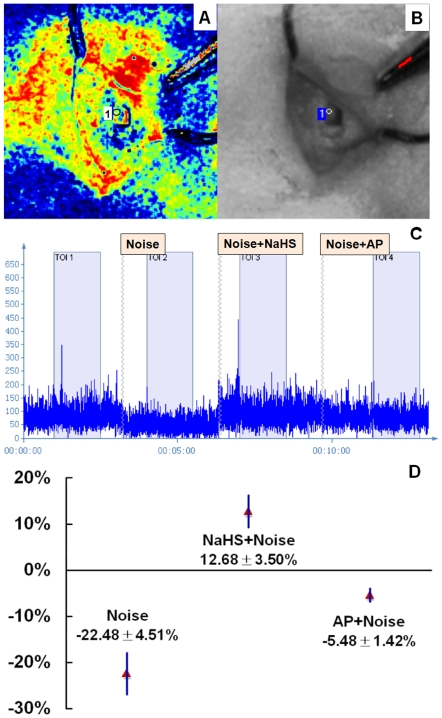
Figure 2. Detection of cochlear blood perfusion.
The cochlear blood flow was detected before and after noise exposure. Post-exposure data were also recorded after previous NaHS or AP administration to identify the effect of H2S. A and B are a recorded blood perfusion image and color photograph, respectively. C represents cochlear blood flow in graphical form. X axis is time and Y axis is blood flow data. A blood flow reduction was observed immediately after noise exposure compared to the pre-exposure blood flow. D shows changes in post-exposure cochlear blood flow after different interventions. Cochlear post-exposure blood flow after NaHS administration increased significantly compared to that after AP administration (n = 7, P<0.05).

