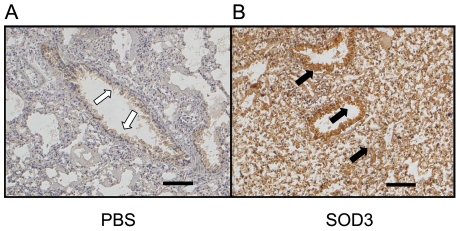
Figure 6. The distribution of aerosolized rhEC-SOD in lung tissue by immunohistochemical (IHC) staining after 96 h of hyperoxia.
A. The image representative the PBS inhalation control group. Only a few of endogenous EC-SOD can be detected in the bronchial epithelia as indicated by open arrows. B. The image representative the rhEC-SOD (SOD3) aerosolized group. The exogenous rhEC-SOD can be strongly detected in the bronchial epithelia, alveoli and lung parenchyma as indicated by solid black arrows. Scale bar = 100 µm.

