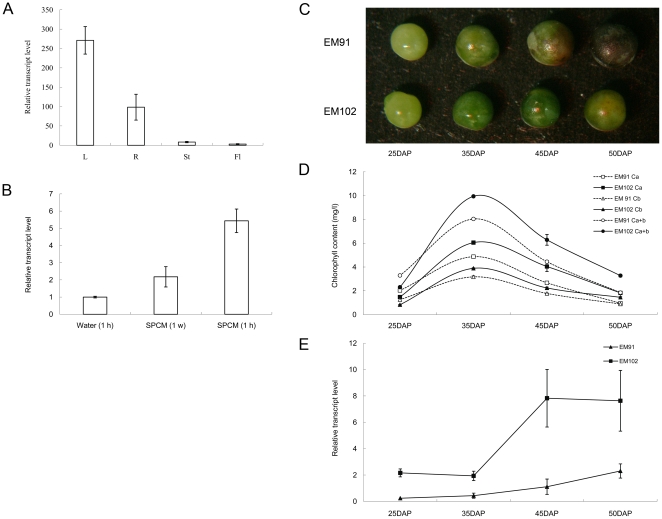
Figure 4. The transcript profiles of BnCLIP1during natural chloroplast senescence and chemical induced chloroplast disruption.
(A) Organ-specific expression of BnCLIPI in the leaves (L), roots (R), stems (St), and flowers (Fl). (B) Expression profile of BnCLIP1 in the leaves treated with SPCM. “Water (1 h)” represents the control, while the half piece of the control leaf that was treated with 100 mg/l SPCM for 1 hour has been designated as “SPCM (1 h).” “SPCM (1 w)” refers to the leaf of the same age soaked in 100 mg/l SPCM for 5 s everyday for 1 week. (C) EM91 (low oil-content) and EM102 (high oil-content) seeds. (D) Chlorophyll content of developing EM102 and EM91 seeds. (E) Expression profiles of BnCLIP1 in EM102 and EM91 seeds at 25 DAP, 35 DAP, 45 DAP, and 50 DAP. DAP represents “day after pollination.” BnActin was used as an internal control.

