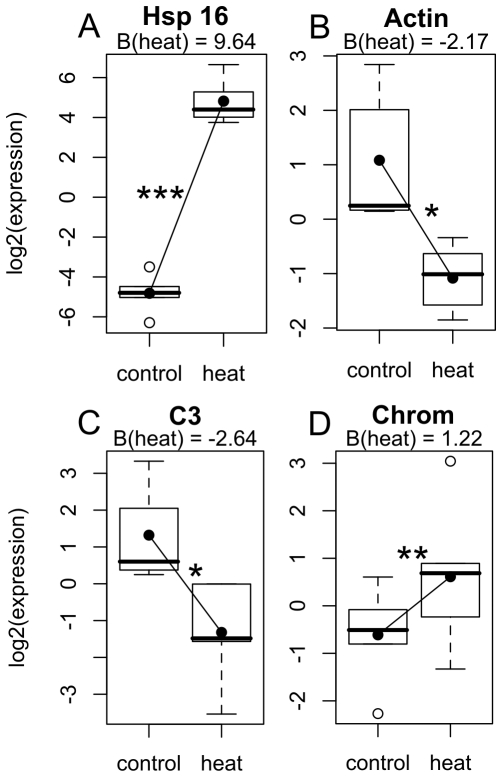
Figure 1. Significant gene expression differences by treatment for Experiment 1 (Porites astreoides).
Box-plots show distribution of normalized expression values for all individuals (n = 5 pairs) by treatment. A thick black line indicates the median of normalized expression values. The box represents the inter-quartile range (IQR) between the upper and lower quartile. The whiskers maximally extend 1.5 times beyond the IQR. Open circles indicate outliers. The black circles within each box are predicted values for the condition based on the linear-mixed model results. Lines connecting dots represent the effect of heat-light treatment, given as B at the top of each figure. Effect significances, after applying a multiple-test correction, are represented by (*) = P<0.05, (**) = P<0.01, (***) = P<0.001. Gene abbreviations: C3 = complement component C3, Chrom = GFP-like chromoprotein.

