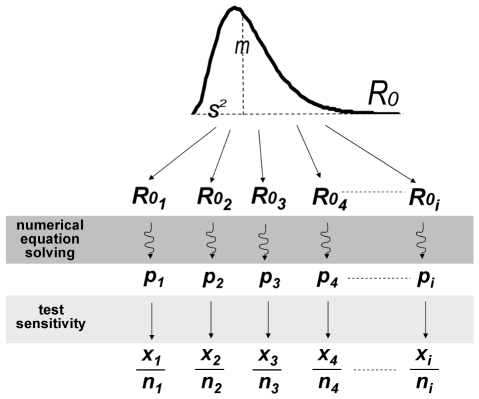
Figure 1. Hierarchical model linking serosurveillance data with R0 in the population of infected flocks, through the final size equation.
m, mean R0 in the population of infected flocks; s2, variance of R0 in the population of infected flocks; R0i, basic reproductive number of each infected flock i; p, final size of the epidemic; x, proportion of positive samples; n, total number of samples.

