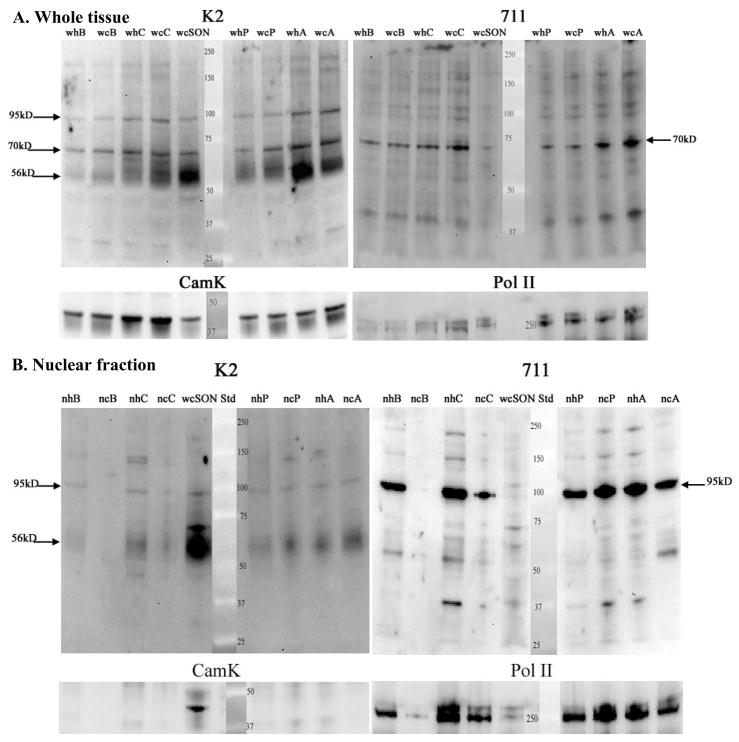
Figure 6.
Comparison of whole tissue homogenates and nuclear fractions from tissue punches of BNST (B), Caudate (C), SON (S), PVN (P), amygdala (A). For the nuclear fraction, tissue punches were pooled from 3–4 animals. Gels were run, blotted and probed with ABs as in Figure 3 (e.g. sequential reaction with K2, 711, CamK, and Pol II ABs). A. Whole tissue homogenates probed with the N-terminal (K2) and 2nd extracellular loop (711) ABs. With the K2 AB, the 3 bands described in Fig 3 (56–65kD, 70kD, and 95kD) are evident in most brain regions, but regional differences in abundance are evident (see Fig 8). The 70kD band is prominently recognized by the 711 AB in whole tissue homogenates from most brain regions, but the affinity of this AB for the 56–65 kD band is much lower than the K2 AB. B. Nuclear fractions from the same regions as in Part A. Whole tissue homogenate of SON is included for comparison (wS; lane 4 in Fig 6B). The K2 AB detects a prominent 56–65kD band in nuclear fractions from BNST, Caudate, PVN, and Amygdala. This is not due to cytoplasmic contamination, because CamK is only evident in the whole tissue homogenate of SON. This supports the interpretation that the entire NK3 molecule translocates to the nucleus. The 711 AB shows enrichment of the 95kD band compared to blot in A. Pol II serves as loading control and demonstrates unintentional low loading of lane 2 as well as differential loading of lanes 3 and 4. Multiple samples of each brain region were prepared and all brain regions were analyzed on at least 2 blots.

