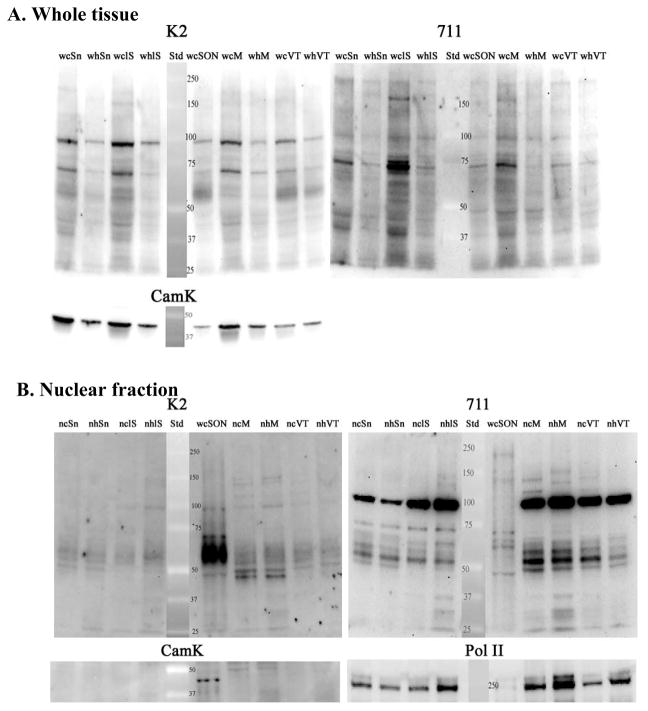
Figure 7.
Comparison of whole tissue homogenates and nuclear fractions from tissue punches of substantia nigra (SN), lateral septum (LS), medial preoptic area (M), and ventral tegmental area (VT). As in Fig 6, tissue punches were pooled from 3–4 animals to obtain the nuclear fraction. Gels were run, blotted and probed as in Fig. 3 (e.g. sequential reaction with K2, 711, CamK, and Pol II ABs). A. Whole tissue homogenates probed with the N-terminal (K2) and 2nd extracellular loop (711) ABs. With the K2 AB the 3 bands seen in Figs 3 and 6 are evident in SN, LS, and VTA, but the 56–65kD band is low in MPOA compared to the fairly robust density of the 70kD and 95kd proteins. The 711 AB prominently labels the 70kD band in all of these brain regions, with differential expression reflecting differences in protein loading (see CamK blot). See Fig 8 for comparisons of relative abundance of NK3-ir bands across brain regions. B. Nuclear fractions from the same regions as in Part A. Whole tissue homogenate of SON is included for comparison (wS; lane 5). K2 AB: The 5665kD protein is prominent in all of these brain regions, and again, is not due to cytoplasmic contamination (see CamK picture). Again, this supports the interpretation that the entire NK3 molecule enters the nucleus in these brain regions. The 711 AB shows enrichment of the 95kD band. Pol II serves as loading control. Multiple samples of each brain region were prepared and all brain regions were analyzed on at least 2 blots.

