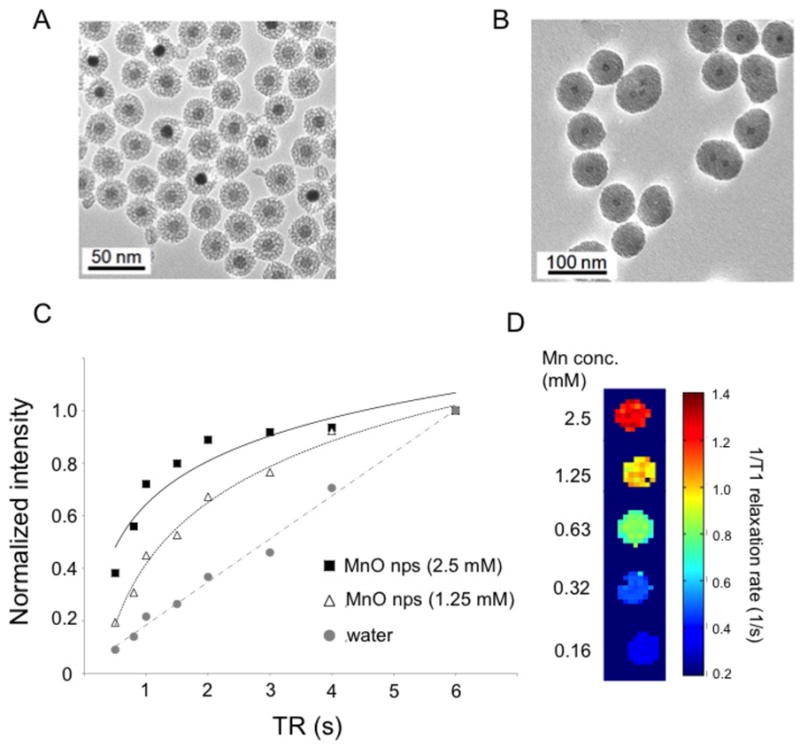
Figure 2. Characterization of IONP and MONP.

TEM images of IONP (A) and MONP (B). The mean diameter of the nanoparticles was 40 and 70 nm for IONP and MONP, respectively. (C) Plot of normalized MR intensity versus repetition time for MONP. (D) 1/T1-weighted MR color map of MONP.
