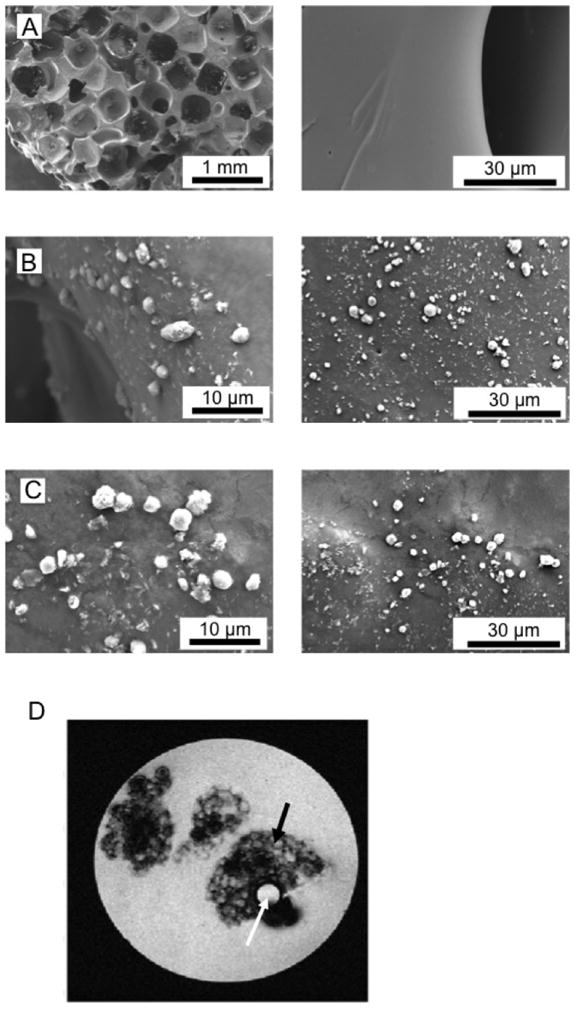
Figure 3. Characterization of the scaffold.

(A) SEM image showing the surface of the two control scaffolds. The left panel shows the porous structure; the right panel the clean surface. (B) SEM image showing the attachment of nanoparticles on the scaffold mixed with the nanoparticles. Large aggregates of nanoparticles have been adsorbed to the surface of the PPF scaffolds. (C) SEM image of Dox-carrying nanoparticles, which have been attached to the surface of the scaffolds after the scaffolds are coated with the particles. (D) MRI of a sample tube containing several small pieces of PPF scaffold (5 mm thickness) in PBS. Black arrow: porous structured PPF scaffold. White arrow: capillary containing water as a control.
