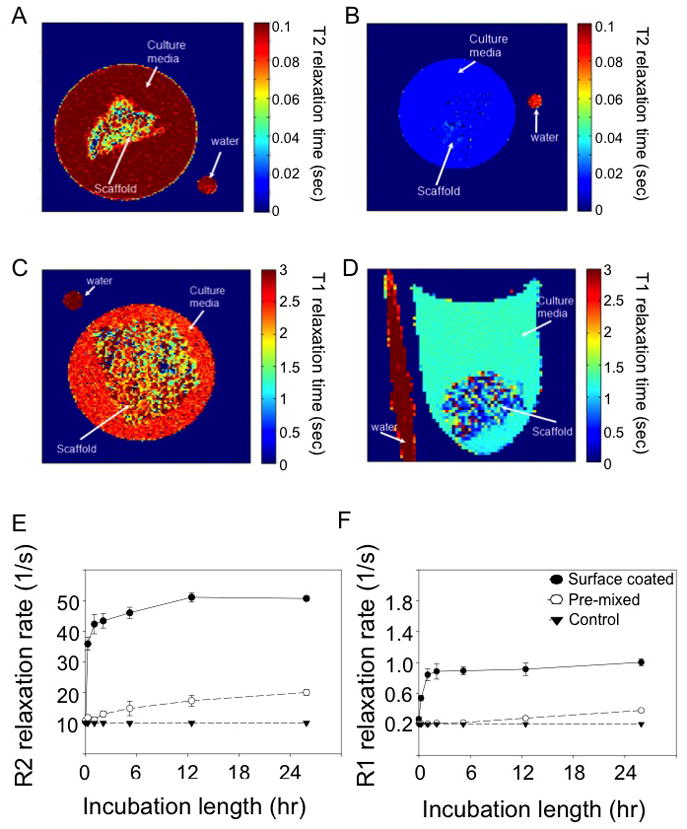
Figure 4. Quantification of drug release using MRI signal changes.

T2 relaxation map of control scaffold (A), and PPF scaffolds coated with IONP (B). T1 relaxation map of control scaffold (C) and PPF scaffolds coated with MONP (D). All the maps were acquired after 48 h incubation at 37ºC in PBS. Plots of 1/T2 (E) and 1/T1 (F) relaxation in the solution versus the length of scaffold incubation. Both 1/T2 and 1/T1 shortening were proportional to the amount of Dox-coated nanoparticles that had been released from each scaffold.
