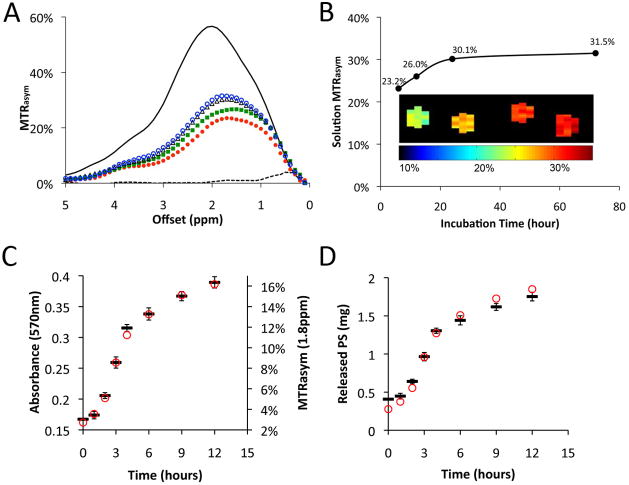
Figure 5. Release of PS from PPF scaffolds, as measured with CEST MRI.
(A) Plot of MTRasym versus irradiation frequency offset. The solution surrounding the PPF scaffold coated with PS was sampled at different time points: red solid circle (
 ): 6 hours; green solid square (
 ): 12 hours; black open triangle (△): 24 hours; blue open circle (
 ): 72 hours. Solid line=5 mg/mL protamine sulfate; dashed line=PBS. (B) The MTRasym at 1.8 ppm shows an increase with incubation time due to the release of PS from the PPF scaffolds. Inset: MTRasym map showing CEST signal intensity corresponding to the plot in B0, which provides direct visualization of the released PS into the solution. (C) Samples at different time points were measured with CEST MRI (red circle,
 ) and BCA assay (black hyphen symbol -; average ± standard deviation, n=3). (D) The mass of PS released from the 3 scaffold disks (mean weight of disk= 41.8±0.54 mg, as in C above) placed in 1 mL of PBS as calculated using a standard curve. Plots in C and D represent data from two independent measurements.

