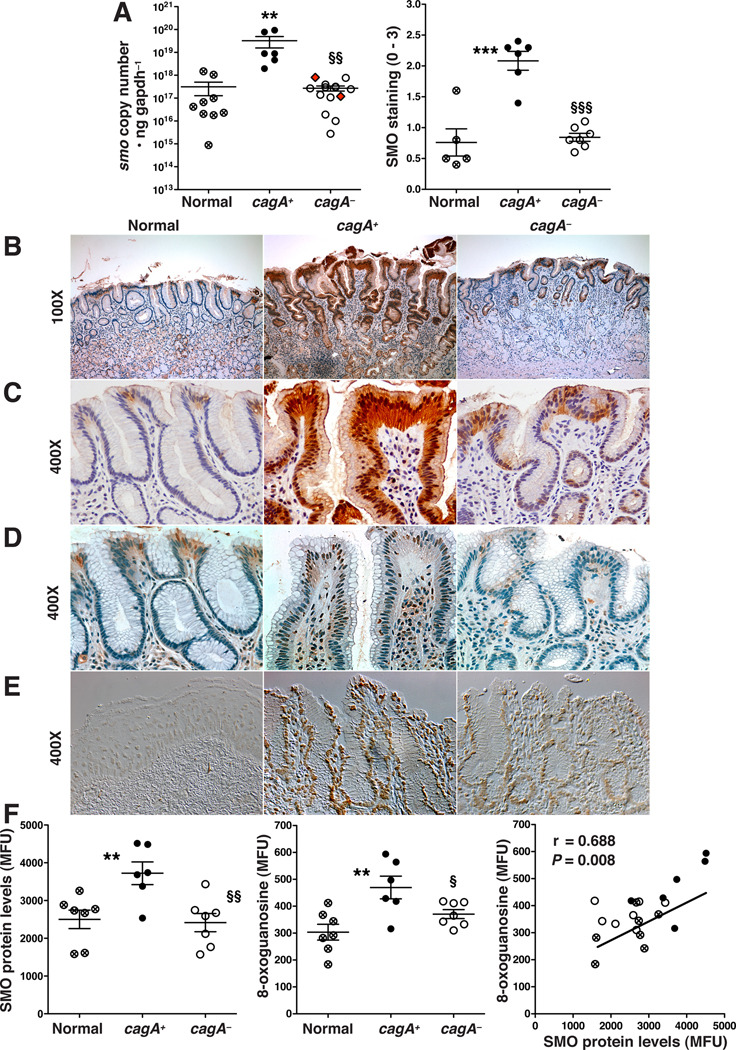
Figure 5.
Levels of SMO, DNA damage, and apoptosis in human antral gastric biopsies. (A) Left panel: SMO mRNA expression measured by TaqMan PCR; red diamonds indicate strains PCR-positive for cagA, but CagA protein-negative (Supplementary Figure 6A); right panel: scoring of SMO staining intensity in epithelial cells from immunohistochemistry analysis. (B, and C) Immunohistochemistry for SMO. (D) Immunohistochemistry for 8-OHdG. (E) Levels of apoptosis by ISOL, imaged by DIC microscopy. (F) Gastric epithelial cells were isolated from gastric tissues and analyzed by flow cytometry. Left panel: levels of SMO; middle panel: levels of DNA damage; right panel: correlation (Pearson coefficient) between SMO and DNA damage levels. In A and F, each circle is a different patient; **P < .01, ***P < .001 versus uninfected normal tissues, §P < .05, §§P < .01, §§§P < 0.001 versus cagA-positive tissues.

