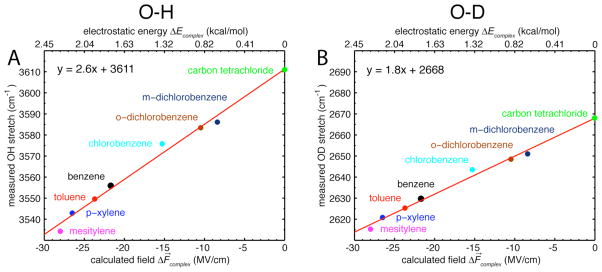
Figure 3.
(A, B) Plot of the measured frequencies of the phenol OH/OD stretch in different solvents versus the calculated projections of the electric field along the OH/OD bond. The straight line shows the best fit using only data for the aromatic solvents, and the slope of this line corresponds to the theoretical Stark tuning rate. Extrapolation of this line to ΔF⃗complex = 0 leads to a prediction for the frequency of OH (or OD) in the absence of complex formation that agrees well with the OH/OD stretch in carbon tetrachloride.

