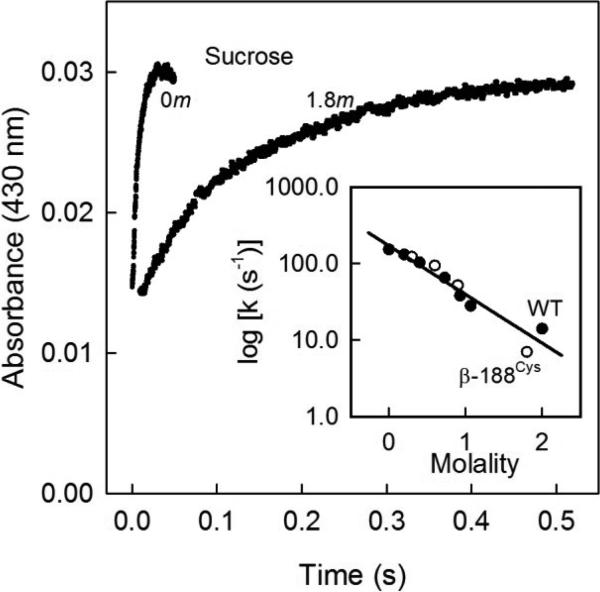
Figure 7. Osmotic pressure effects on electron transfer reactions from Fe protein to MoFe protein.
Stopped-flow traces for ET from the Fe protein to the ß-188Cys MoFe protein in the presence of 0, 0.6, 0.9 and 1.8 m sucrose (traces for 0 and 1.8 m sucrose are shown). The observed slow phases of the traces were fit to an exponential function to determine the rate constant (kobs). (Inset) The log of the rate constants (kobs) are plotted against the osmotic pressure of sucrose (m) for the ß-188Cys (open circle) and wild-type (WT, closed circle) MoFe proteins and the points are collectively fit to a straight line.

