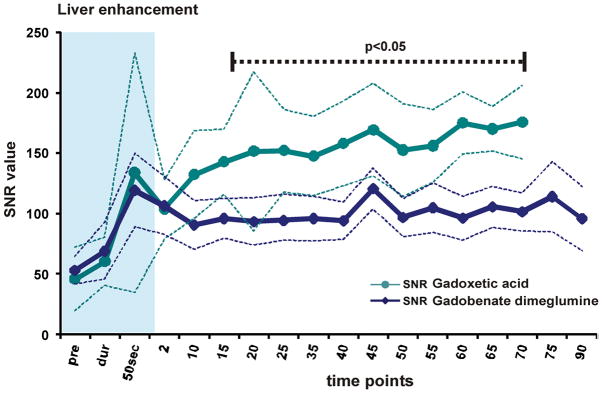
Figure 3.
(A) SNR of liver and (B) SNR and CNR muscle vs liver tissue. SNR is displayed by solid lines, CNR by dashed lines with data points. Thin dashed lines represent average ± 95% confidence interval over all subjects. Liver SNR with both agents is similar during the dynamic phase, and shows advantages for gadoxetic acid during the delayed phase. Muscle enhancement shows overall similar values. However, CNR of muscle vs. liver of gadoxetic acid is superior throughout most of the time course. Significance levels are indicated where differences showed statistical significance to the p<0.05 level. The blue shaded area represents the dynamic phase. Due to study design, measurements at 5 and 30 minutes were not acquired.

