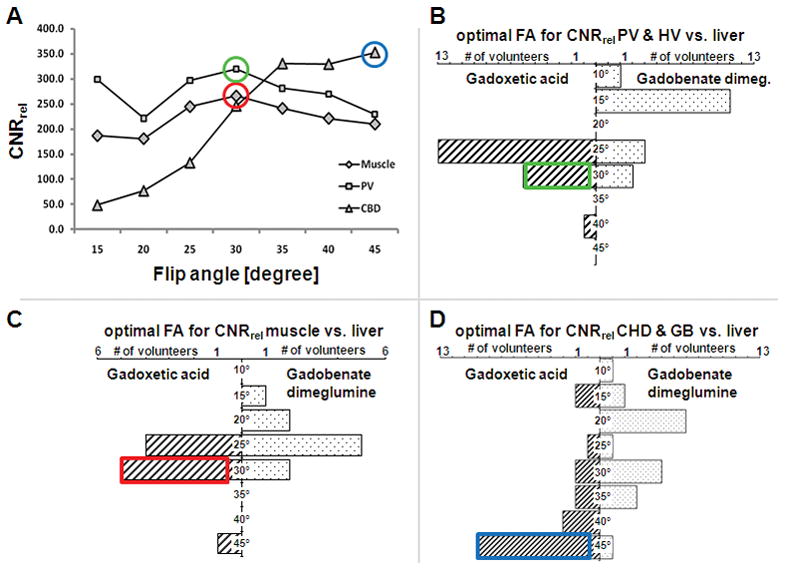
Figure 7.

Distribution of optimal flip angles by means of CNRrel compared to liver tissue. (A) plots of flip angle vs. CNRrel using gadoxetic acid in a single volunteer. The optimal flip angle was determined in every volunteer for both agents. Data from all volunteers was then binned into the plots for imaging vessels (B; PV=portal vein, HV = hepatic vein), muscle (as a surrogate for non-hepatocellular tumor tissue, C), and biliary tree (D; GB = gallbladder, CHD = common hepatic duct).
