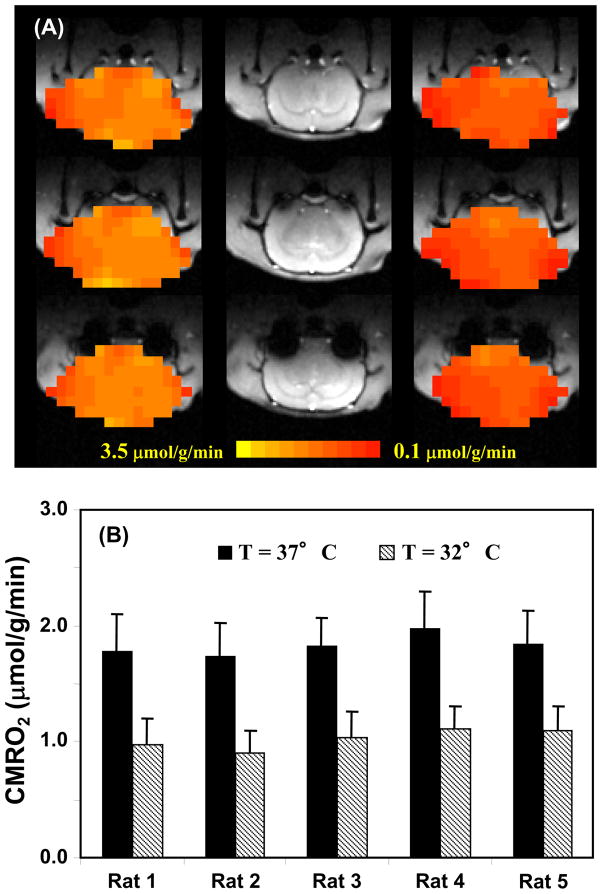
FIG. 9.
(A) Anatomic images (middle column) of a representative rat brain and the corresponding multi-slices CMRO2 maps obtained using 3D 17O-CSI approach at 9.4T under normothermia (left column) and hypothermia (right column) conditions, (B) Summary of CMRO2 results measured at normothermia and hypothermia conditions (n=5). Adapted from Zhu et. al. JCBFM 2007; 27(6): 1225–1234.

