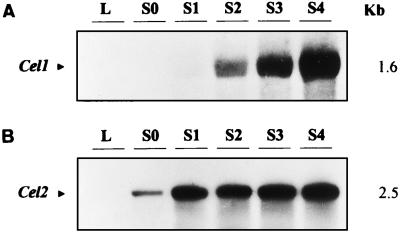
Figure 4.
Northern analysis of the expression of Cel1 (A) and Cel2 (B) in leaves (lanes L) and fruit at different stages of growth and ripening. Lanes S0, Green fruit; lanes S1, white fruit; lanes S2, fruit with one-fourth red surface; lanes S3, fruit with three-fourths red surface; and S4, fully red fruit. Each lane contained 20 μg of total RNA. Northern blots were hybridized with random-primed probes obtained from full-length cDNAs. Both Northern blots were exposed overnight at −80°C.

