
Figure 2.
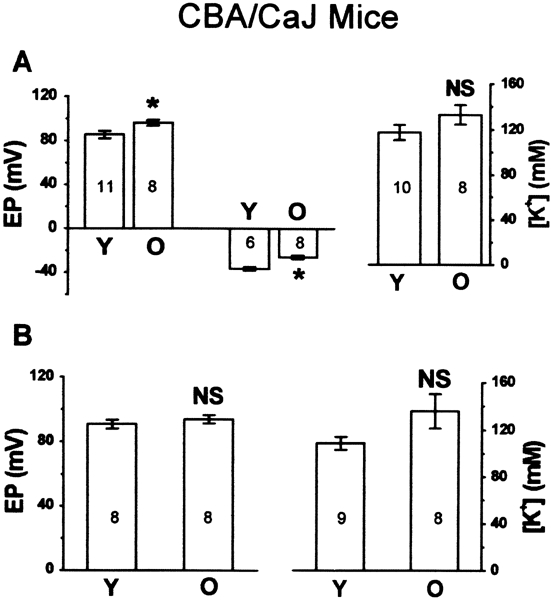
Age-related changes of endocochlear potential (EP) and endolymphatic potassium concentration ([K+]) in CBA/CaJ mice. A. Apical turn: left panel:EP of young (Y) and old (O) groups, including normoxic EP (left two bars) and anoxic −EP (right two bars); right panel: [K+] of young and old groups. B. Basal turn: left panel: normoxic EP of young and old groups; right panel: [K+] of young and old groups. NS, p > 0.05; *, p < 0.05.