
Figure 7.
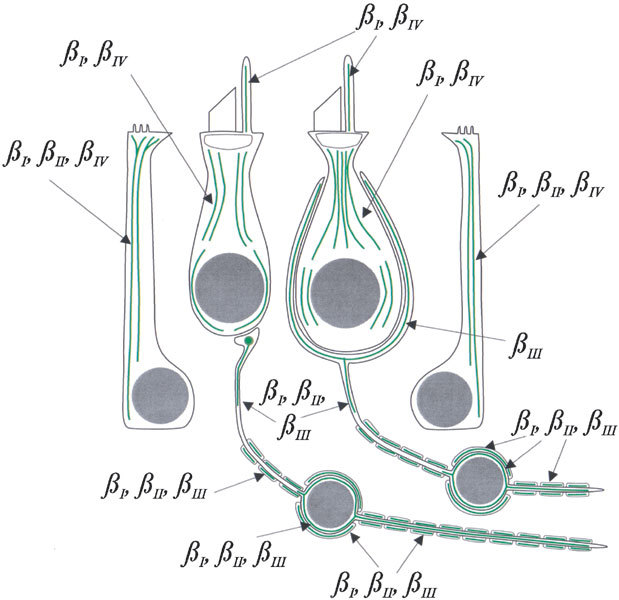
Diagram of the distribution of β tubulin isotypes in vestibular epithelial cells and neurons, based on the results of this study. Type I hair cell right of center, type II hair cell left of center, macular supporting cell right, crista supporting cell left.