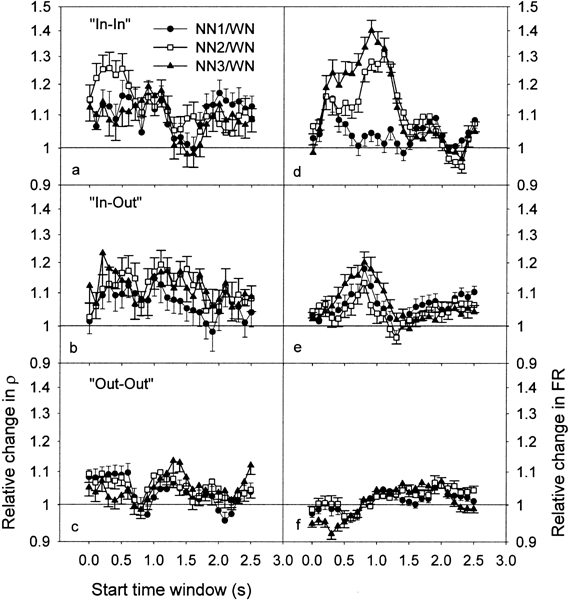
Figure 8.

Ratios of ρ for the 26 TWs and for the 3 conditions of NN, i.e., NN1 (filled circles), NN2 (open squares), and NN3 (filled triangles), for “In–In” (a), “In–Out” (b), and “Out–Out” groups (c). The ratios of the geometric mean of the firing rate are also plotted (d,e,f). Error bars indicate the standard error of the mean.
