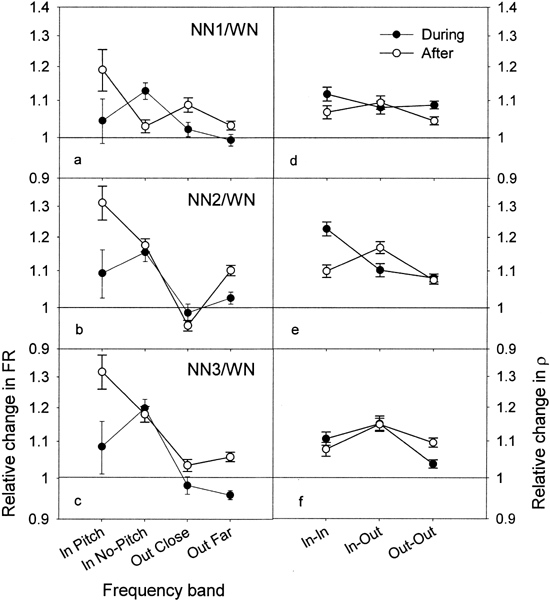
Figure 9.

Summary of the results for all the NN conditions in terms of both FR ratios (a,b,c) and ρ ratios (d,e,f), in function of the distance between a neuron’s CF and Nc (see text). The “During”values correspond to the averaged data of the six TWs starting between 0 and 0.5 s (filled circles), and the “After” values correspond to averaged data of the six TWs starting between 1 and 1.5 s (open circles). Error bars indicate the standard error of the mean.
