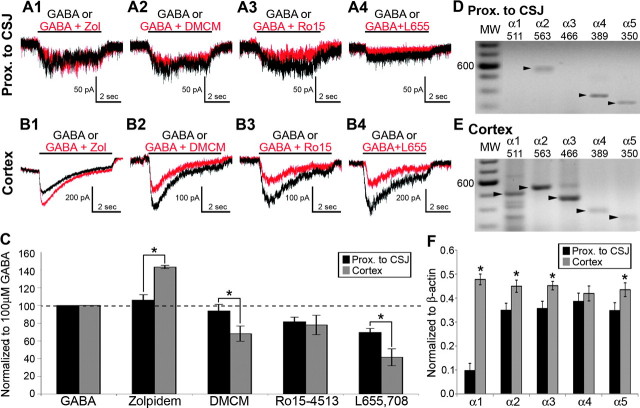
Figure 3.
Expression of GABAA receptor α-subunits in individual BAC-Lhx6 eGFP+ cells in the area before the CSJ and cortex. (A and B) Whole-cell responses of eGFP+ cells in the area proximal to the CSJ (A) or the cortex (B) to focal coapplication of GABA either alone (100 μM; black traces) or in conjunction with zolpidem (100 nM; A1 and B1; red traces), DMCM (100 nM; A2 and B2; red traces), Ro15-4513 (1 μM; A3 and B3; red traces), and L655,708 (10 μM; A4 and B4; red traces). (C) Percentage change in the amplitude of GABA-induced current responses in the presence of GABAA receptor modulators in eGFP+ cells examined in the area proximal to the CSJ (black bars) and cortex (gray bars). Data are expressed as mean ± SEM. The dashed line denotes no change from the current elicited by the application of GABA alone. (D and E) Example of individual eGFP+ cells harvested from the area proximal to the CSJ (D) and the cortex (E) and profiled for their expression of GABAA receptor α1–5 subunits. The darker bands in the molecular weight (MW) ladder lanes denote the 600-bp position. Each arrowhead points to the predicted size of the amplicon detected for the corresponding α-subunit transcript, which are also given at the top of each lane. (F) Semiquantitative determination of the abundance of GABAA receptor α-subunit transcripts (α1–5) relative to β-actin in the same eGFP+ cells harvested from the area proximal to the CSJ and the cortex. Data are expressed as mean ± SEM. Asterisk denotes a significant difference in the normalized GABA + modulator response amplitude between eGFP+ cells from the area proximal to the CSJ and the cortex (C) or transcript abundance (F) relative to that found in the CSJ (p < 0.05, Student's t-test).

