
Figure 1.
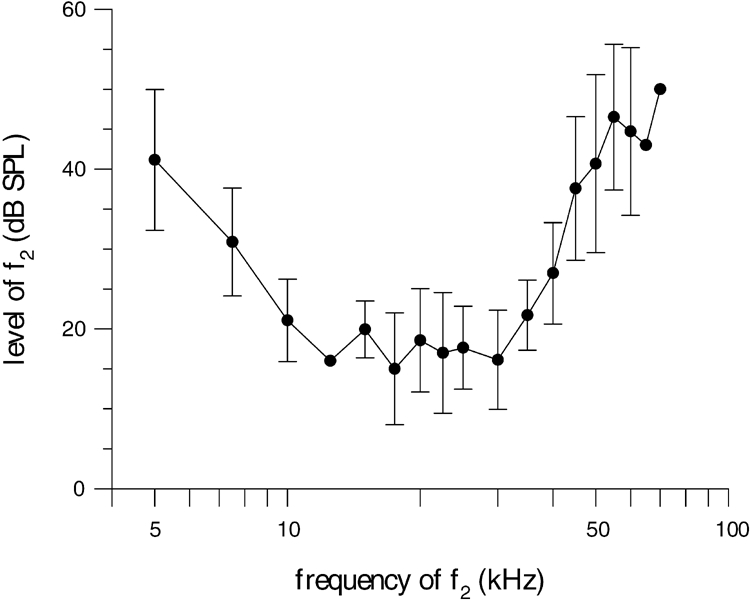
DPOAE threshold curve from 5 to 70 kHz for E. telfairi. The level of f2 (l2; l2 = l1 − 10 dB) sufficient to generate a 2f1 − f2 DPOAE of −10 dB SPL is plotted as a function of the f2frequency. The best frequency ratios (f2/f1) resulting in highest levels of 2f1 − f2 ranged from 1.11 to 1.29. No significant correlation between the best frequency ratio and f2 could be found. Means (filled circles) and standard deviations (error bars) are shown.