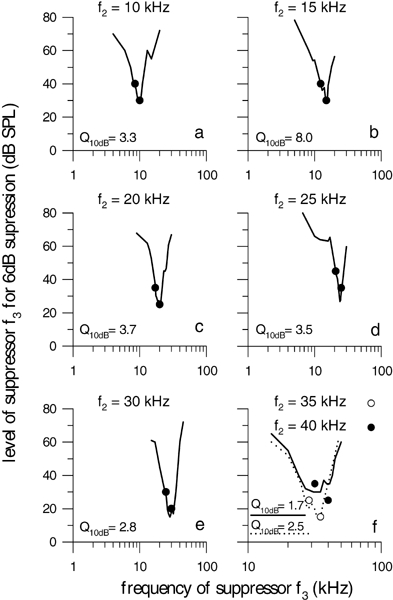
Figure 2.

DPOAE isosuppression tuning curves from one animal. The level of f3 necessary to suppress 2f1 − f2 by 6 dB is plotted as a function of the frequency of f3. Circles represent the frequency and level of the primaries. The STC’s Q10dB values are shown in the lower left of each panel. For f2 frequencies greater than 30 kHz, the minimum of the STCs no longer follows the primary frequencies. The f2 frequency is indicated at the top of the corresponding panel. The best frequency ratios (f2/f1) resulting in highest levels of 2f1 −f2 ranged from 1.11 to 1.33. There was no correlation between the best frequency ratio and the Q10dB value. The level of f2 was set to the level of f1 – 10 dB.
