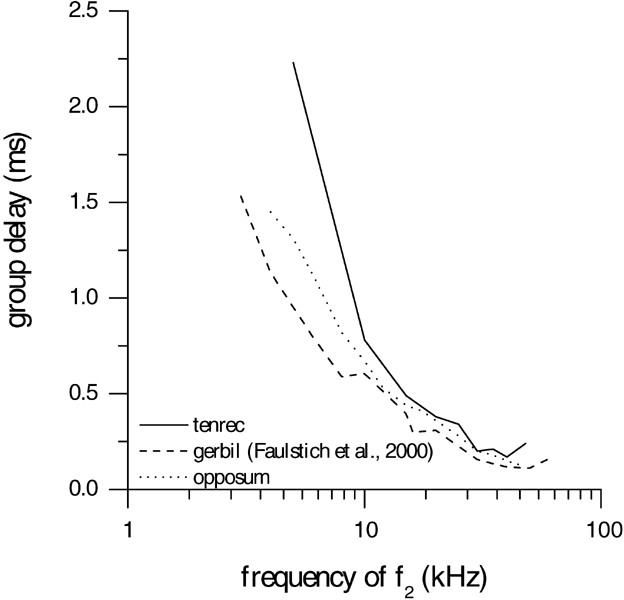
Figure 3.

The group delay (ms) of the distortion product as a function of frequency (kHz) of the tenrec (solid line). For comparison, data from the gerbil (dashed line) and the opossum (dotted line) are shown. To determine the group delay, f2 was held constant while f1 was decreased in small steps. For each f1 step, the 2f1 − f2 DPOAE level and its phase was determined as a function of the 2f1 − f2 frequency. Fromthe change in DPOAE phase relative to the change in frequency, the mean group delay values were calculated over all values for which the ratio curve was at least 6 dB above noise floor.
