
Figure 7.
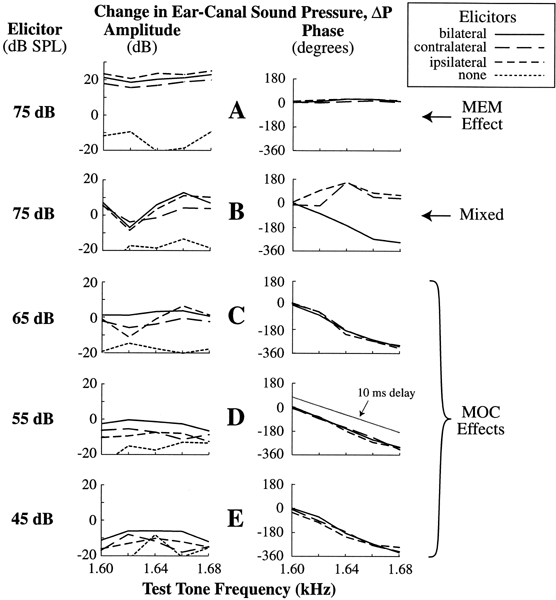
Example group delay tests for medial efferent (MOC) versus middle-ear muscle (MEM) activity. Shown are ΔSFOAE phase versus probe-frequency plots for contralateral, ipsilateral, and bilateral broadband (nonflattened) noise elicitors in one subject (No. 31, subject Group C). The points were every 20 Hz (at the frequency tick marks). Rows B–E had a probe-tone level of 30 dB SPL; row A had a probe-tone level of 50 dB SPL. The long group delays (i.e., high slopes in the phase vs. frequency plots) for 45–65 dB SPL elicitors indicate that MOC effects dominated at these levels (the straight line in the row D phase plot shows the slope for a 10 ms delay). The short group delays for the 75 dB elicitor and 50 dB probe tone (row A) indicate that MEM effects dominated the response. The group delays for the 75 dB elicitor and 30 dB probe tone (row B) show evidence of both long and short group delays and are designated “Mixed” (see text).