
Figure 8.
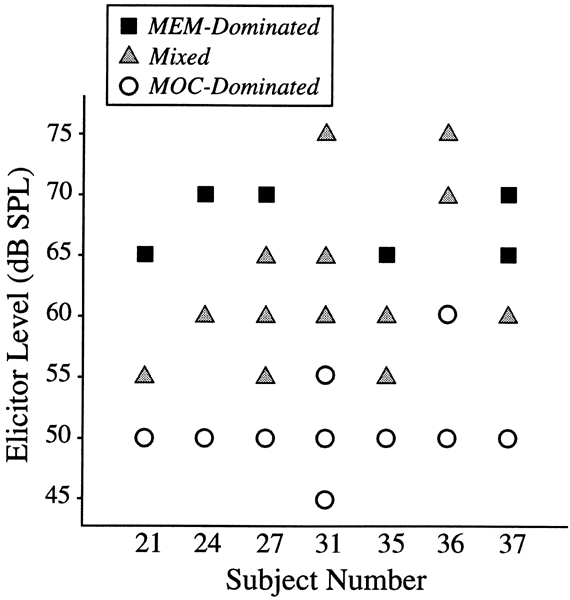
Medial efferent vs. middle-ear muscle test results for 7 subjects (Group C). Symbols indicate the elicitor levels at which the response was dominated by middle-ear muscle activity (MEM), medial efferent activity (MOC), or showed evidence for both (Mixed - see text for details). Probe frequencies between 1 and 2 kHz. Elicitors: unflattened broadband noise. The numbers of runs done at each level for each subject (in order of highest to lowest level) were: S21: 2,3,2; S24: 3,1,1; S27: 2,1,1,3,2; S31: 2,3,5,3,6,2; S35: 2,1,1,3; S36: 1,1,1,1; S37: 1,1,1,1.