
Figure 3.
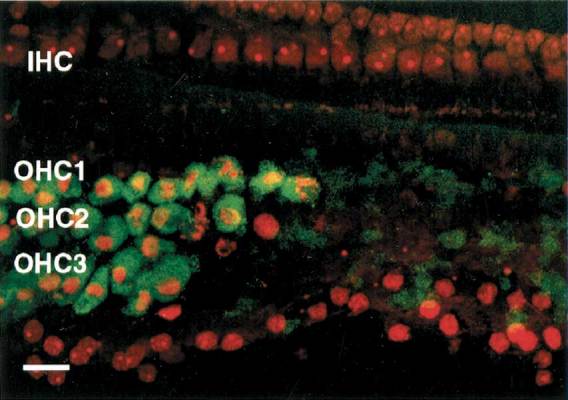
Image illustrating caspase-3 labeling and with PI in the organ of Corti in a large lesion collected 2 days after noise exposure. On the left side of the image, where most of the nuclei appear shrunken and irregular in shape, there is increased PI fluorescence along with positive caspase-3 labeling in these apoptotic OHCs. On the right side of the image, virtually all of the OHC nuclei have disappeared. However, there is a trace of caspase-3 fluorescence remaining in this area. Scale bar = 15 µm.