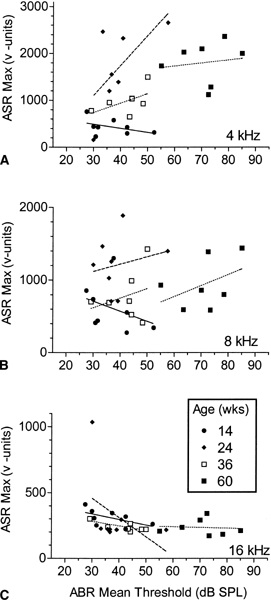
Figure 4.

Scatterplots showing the relationship for the C57BL mice between the mean ABR threshold (across all frequencies) and the maximum mean ASR value at any level. Each point represents the data from one mouse, and the mice appear once for each of the three ASR frequencies. Note the negative slope of the regression lines at 16 kHz for all ages and for all the ASR frequencies at 14 weeks of age, these showing that higher ASR values accompanied greater hearing sensitivity. All other slopes were positive, showing the tendency for the mice with greater hearing loss to respond more vigorously to-low-frequency stimuli within the older groups. (Pearson product–moment correlation coefficients are provided in Table 2.)
