Figure 3.

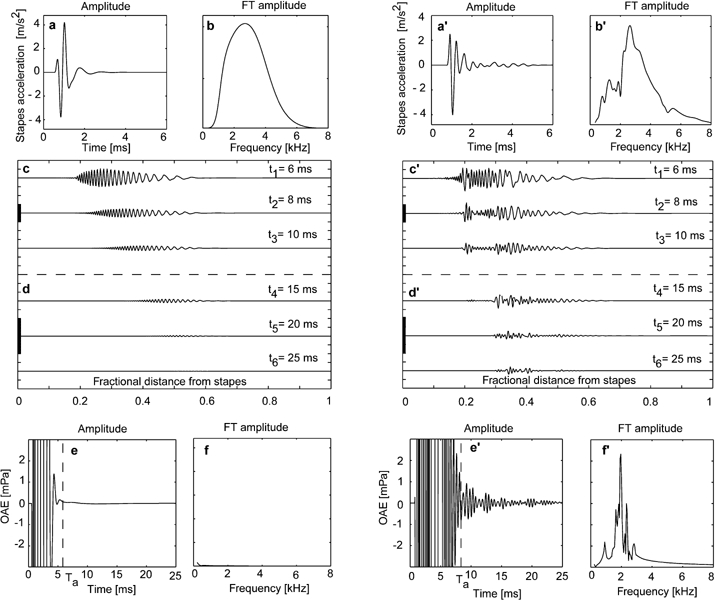
Transient evoked otoacoustic emissions simulated by the nonlinear cochlear model in the time domain. a, a′. Time waveform of stapes acceleration used as input to the inner-ear model and corresponding Fourier transform (FT) amplitude (b, b′). c–d, c′–d′. Time course of basilar membrane (BM) oscillations following inputs shown in a, a′ plotted at different scales (thick vertical bars, 10 m/s2). e, e′. Simulated otoacoustic emissions and corresponding FT amplitude (f, f′). a–f represent response characteristics of a click filtered through an ideal middle ear with smooth transfer function. Note the absence of any appreciable OAEs. a′–f′ represent similar data for an input click filtered by a middle ear with the transfer functions shown in Figure 1c.
