
Figure 4.
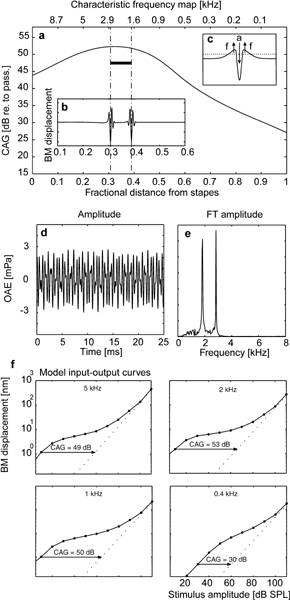
Cochlear amplifier (CA) gain and its effects on spontaneous otoacoustic emissions. a. Profile of the model CA gain: Ordinates, dB scale as ratio of BM velocity in the active cochlea for near-threshold stimuli to BM velocity in the passive cochlea; upper abscissa, characteristic frequency (kHz); lower abscissa, fractional distance from stapes; thick solid bar marks slight decrease of distributed control parameter λ(x) causing spontaneous basilar membrane (BM) oscillations (b). c. Conceptual sketch to indicate how acceleration of a BM portion (a labeled downward arrow) causes lateral rebound forces (f labeled upward arrows) responsible for unbalancing undamping in the cochlea. Forces rebounding from localized deceleration may overcome a critical threshold (dotted line) starting self-sustained BM oscillations. d. Emissions arising when a subthreshold-noise-like input is applied to the stapes in the conditions described in b, simulating spontaneous OAEs. e. Spectrum. f. Input–output curves of basilar membrane (BM) displacement at the indicated characteristic frequencies for the active cochlea model (solid lines) and the passive model [λ(x) ≡ 0, dotted lines].