
Figure 5.
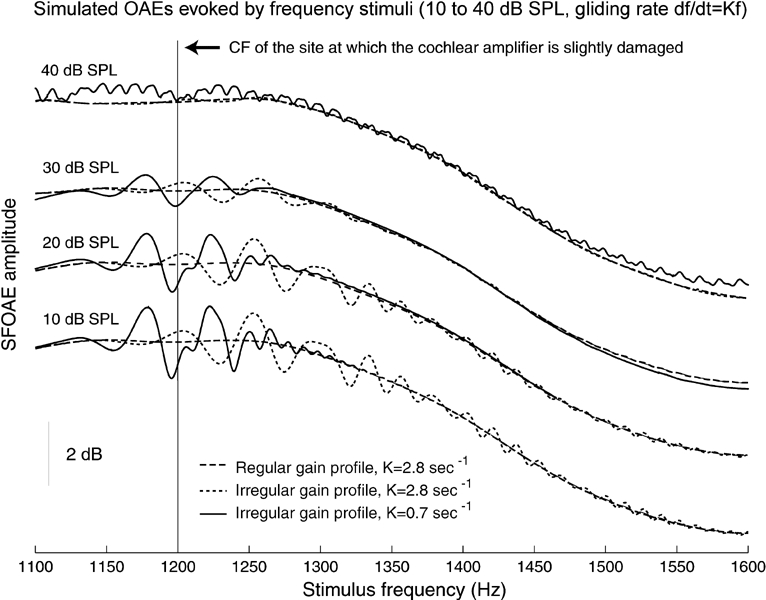
Stimulus-frequency otoacoustic emissions. Model emissions detected at the eardrum, elicited by stimuli of 10–40 dB SPL and frequency f slowly varying according to the law df / dt = Kf, were simulated by a time-domain implementation of the model described in the text. Solid lines: (K = 0.7 s−1) emission generated when the cochlear amplifier (CA) is slightly defective at the BM site of CF = 1.2 kHz. Dotted lines: the same, with K = 2.8 s−1. In both cases, modulations of maximum ~2 dB amplitude and ~50 Hz spacing, extending over an interval of ~250 Hz, are noted in the emission profile; their amplitude is larger at smaller input levels and is negligible when the BM response reaches the saturation level of the CA (35–40 dB SPL). Dashed lines: (K = 2.8 s−1) emission of a cochlea with regular (smooth) CA gain profile; no modulations are noted. Traces were offset vertically for clarity.