
Figure 7.
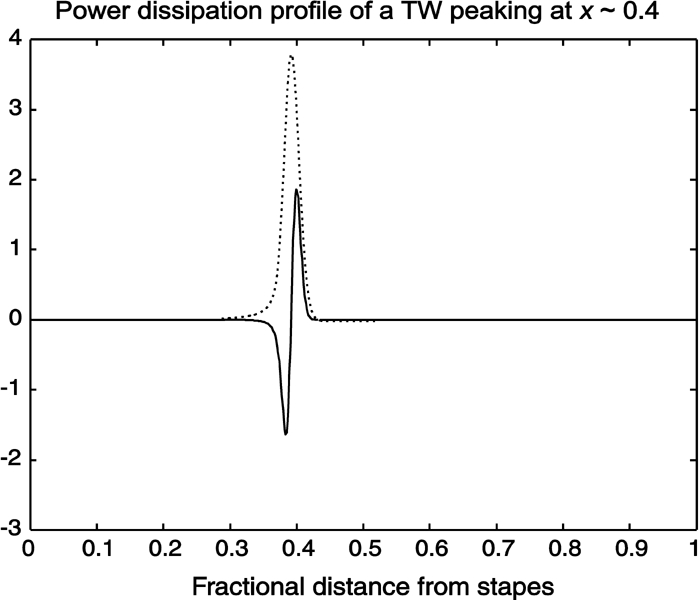
Source-sink power balance in the active cochlea. Solid line: power dissipation profile of a traveling wave. It is negative in the region where the cell motors deliver their excess power and positive where the shearing viscosity is mostly effective, i.e., on the TW decline, where the wavelength shrinks to zero. The oscillation is stable, however, because the dissipation integrated over the BM length is positive. Dotted line: amplitude of the TW. Note that the zero of the power dissipation profile is very close to the TW peak.