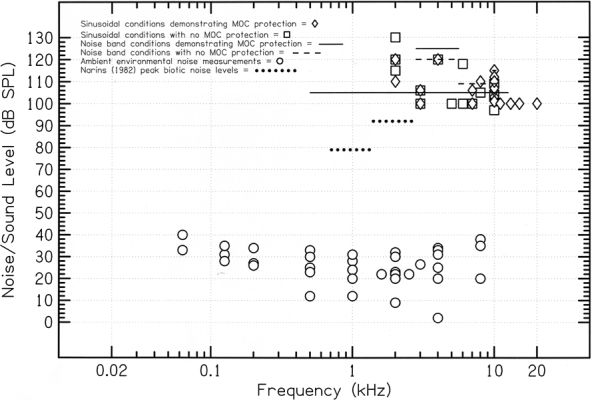
Figure 1.

Diagrammatic plot of naturally occurring noise conditions and stimulus parameters employed in experimental studies of MOC-mediated protection from acoustic trauma. Natural environmental noise levels are plotted (open circles) for four studies giving absolute acoustic measurements across a range of frequencies (Morton 1975; Narins 1982; Waser and Brown 1986; Reiman and Terhune 1993; see text and Table 2 for description). Frequency and intensity parameters that have been employed in studies of MOC-mediated protection studies, from Table 3, are plotted as those sinusoidal stimulus conditions that yielded a protective effect (open diamonds); those sinusoidal stimulus conditions that failed to demonstrate a protective effect (open squares); the noise band exposures against which the MOC demonstrated a protective effect (solid lines), and the noise band conditions against which the MOC had no apparent protective effect (dashed lines). All noise bands (for both environmental noise and protection studies) are plotted as overall dB SPL vs. total frequency range because insufficient details were provided to plot these acoustic conditions in terms of spectral level.
