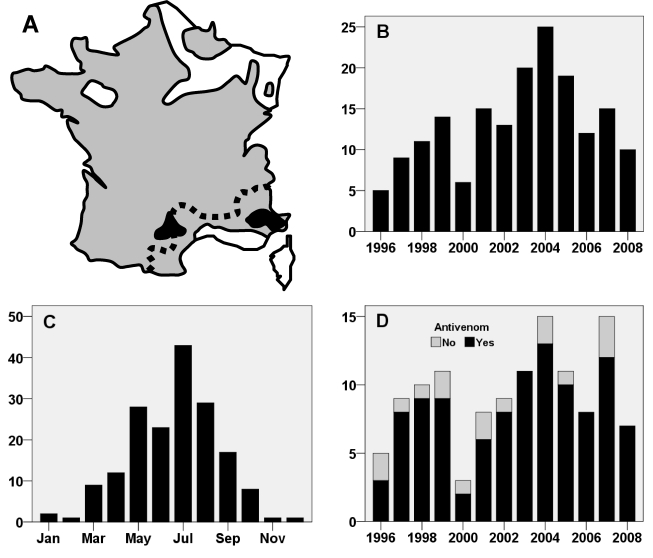
Figure 1.
Asp Viper envenomation, experience of the Marseille Poison Centre between 1996 and 2008. In A, the geographical distribution of dangerous vipers in mainland France is coloured in grey. The two black areas indicate the places where neurotoxic symptoms are observed. Both of them are included in the Marseille poison centre activity zone (all the French Mediterranean coast, at the south of the dotted line). The chronological distribution of the asp viper envenomation of the case series is presented by year in B and by month in C. In D, annual distribution of grade 2 + 3 envenomations with or without antivenom treatment.

