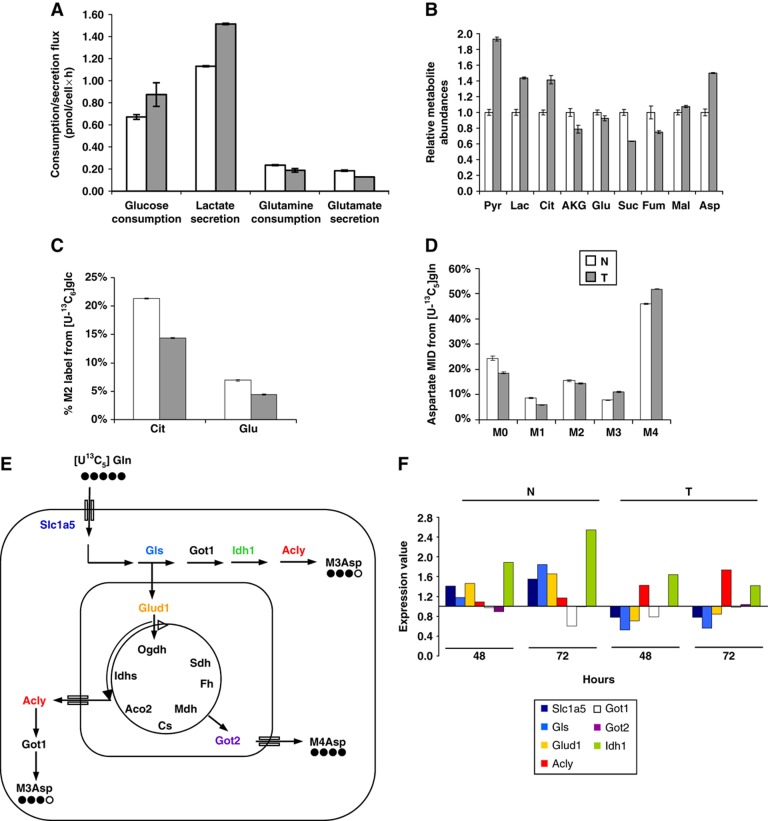
Figure 1.
K-Ras transformed fibroblasts decouple glycolysis and the TCA cycle. (A) Extracellular uptake and secretion of Glc, Lac, Gln, and Glu in N and T cells for 54 h of growth. (B) Relative metabolite abundances in N and T cells measured by GC/MS. (C) M2 labeling of Cit and Glu in N and T cells cultured with a 1:1 mixture of [1-13C]glucose and [U-13C6]glucose. (D) Mass isotopomer distribution (MID) of Asp in cells cultured in the presence of [U-13C5]glutamine. Error bars indicate s.e.m. (n=3). (E) Schematic representation of the metabolic routes involved in M3-M4 Asp labeling by using [U13C5]glutamine tracer. In the scheme are represented the key cytoplasmic and mitochondrial enzymes involved in these metabolic routes. (F) Absolute expression values of some genes, involved in the pathways described in the scheme (E), in N and T cell lines. The two cell lines, grown in 25 mM Glc+4 mM Gln (normal medium), were collected for transcriptional analysis at two different time points (48 and 72 h). The list of gene abbreviations is available in Supplementary information.

