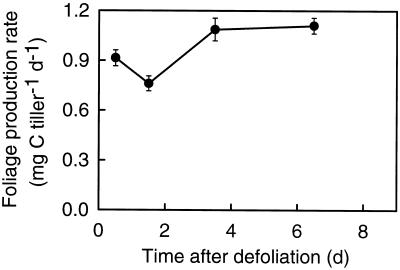
Figure 3.
Foliage production rate in regrowing tillers of perennial ryegrass during the first 8 d of regrowth after severe defoliation. Foliage denotes all leaf (essentially lamina) tissue exposed above the defoliation level. Rates were calculated as the net change over time of C mass in foliage as observed during sampling intervals (see Methods). Vertical bars indicate ±se (n = 16; eight tillers per replicate).

