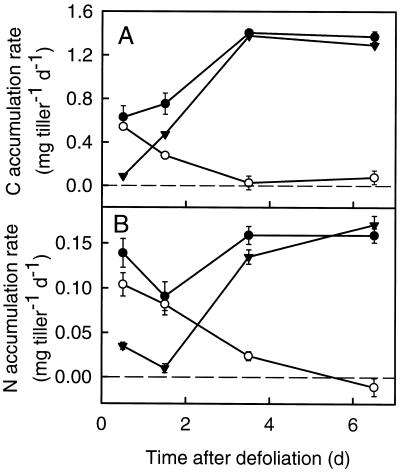
Figure 4.
Net accumulation rate of total C (•), predefoliation C (○), and postdefoliation C (▾) (A) and total N (•), predefoliation N (○), and postdefoliation N (▾) (B) in regrowing tillers of perennial ryegrass during the first 8 d of regrowth after severe defoliation. Rates were calculated as the net change over time of C or N mass (total, predefoliation, and postdefoliation) as observed during sampling intervals (see Methods). The regrowing tiller included the TB and all of the leaves that experienced growth after defoliation but not the leaves that had stopped to expand before defoliation (compare with Fig. 1). Vertical bars indicate ±se (n = 16).

