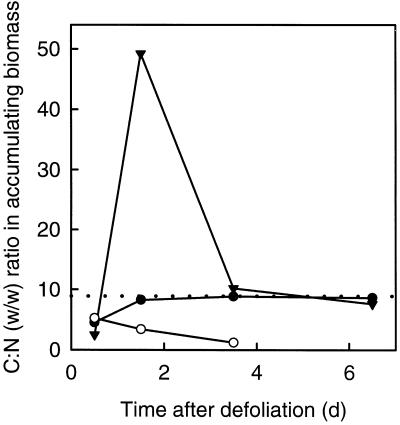
Figure 5.
C:N (w/w) ratio in total biomass (•) and in pre- (○) and postdefoliation biomass (▾) accumulating in regrowing tillers of perennial ryegrass during the first 8 d of regrowth after severe defoliation. Ratios were calculated from the daily net rates of C and N accumulation presented in Figure 4 (compare with Fig. 4 for se). Note that the strong increase in the C:N ratio of postdefoliation biomass accumulating between d 1 and 2 resulted from an increase in the rate of postdefoliation C accumulation and a (concurrent) decrease in the rate of postdefoliation N accumulation. The dotted line indicates the C:N ratio (8.9) of regrowing tiller biomass at 14 d after defoliation, which was the same as in total tiller biomass at defoliation.

