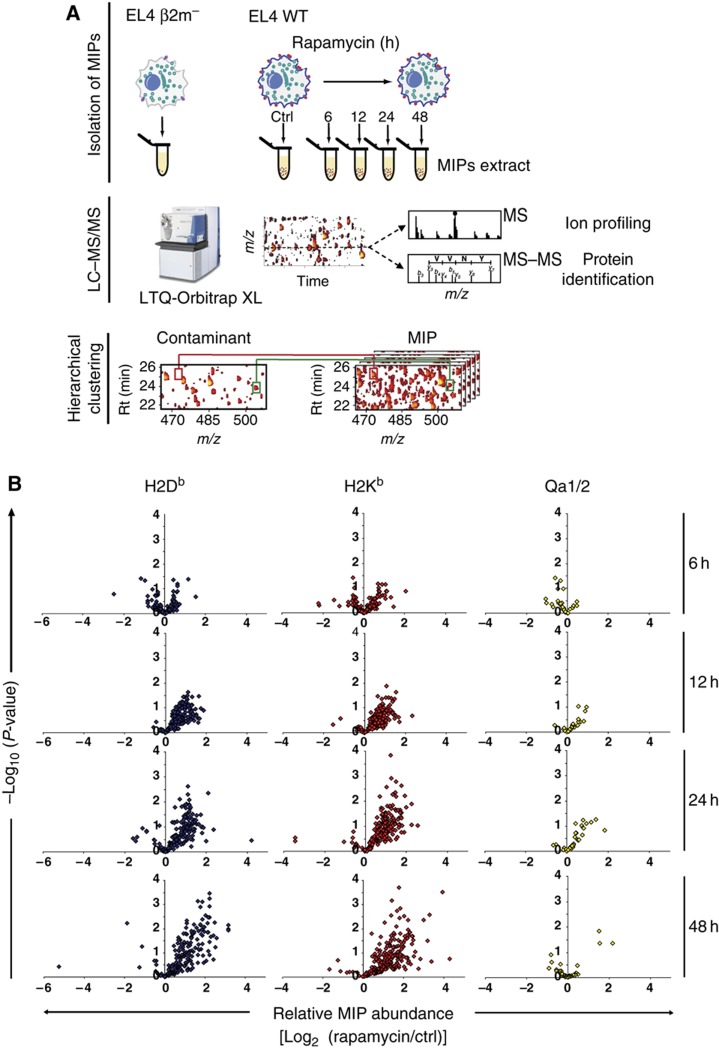
Figure 2.
Rapamycin increases the abundance of MIPs presented by MHC Ia molecules. (A) Experimental design for identification and relative quantification of MIPs. EL4 cells were incubated with 20 ng/ml of rapamycin for 0 h (ctrl), 6, 12, 24 and 48 h. Cells from all experimental conditions were harvested simultaneously. MIPs from rapamycin-treated and ctrl EL4 cells were isolated by mild acid elution and analyzed by nanoLC–MS–MS/MS. Heat maps displaying m/z, retention time and abundance were generated. A logarithmic intensity scale distinguishes between low (dark red) and high (bright yellow) abundance species. Analysis of β2m- mutant EL4 cells allows discrimination of genuine MIPs from contaminants (Fortier et al, 2008; de Verteuil et al, 2010). Examples of peptides that were differentially expressed (red line) or not (green line) between WT and β2m- mutant EL4 cells are highlighted in the boxes. (B) Volcano plots show the relative abundance of 416 H2b-associated peptides identified in three biological replicates at each time point. Six MIPs were detected uniquely after 48 h of rapamycin treatment.

