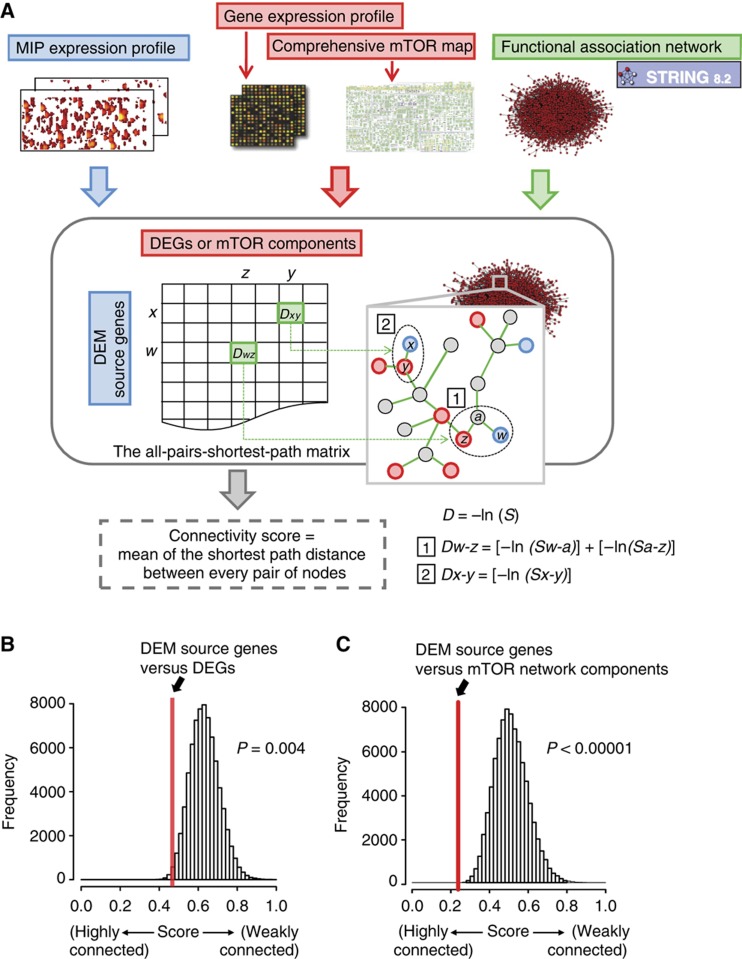
Figure 4.
DEM source genes are tightly connected to transcriptomic changes and the mTOR network. (A) An all-pairs-shortest-path matrix was developed by using computed scores (S) in the STRING database (http://string-db.org/). The all-pairs-shortest-path matrix was used to calculate functional associations between (1) DEM source genes and DEGs and (2) DEM source genes and mTOR network components. Each functional association in the all-pairs-shortest-path matrix was transformed into a distance (D). The matrix shows DEM source genes (rows), DEGs or mTOR network components (columns), and the shortest path distance between every pair of nodes (genes/proteins) in the association network (e.g. Dw-z and Dx-y). A connectivity score corresponds to the mean of the shortest path distance between every pair of nodes in a given matrix. (B, C) The all-pairs-shortest-path matrix was used to calculate functional connectivity scores. The red lines represent the connectivity score between DEM source genes and DEGs (B), and between DEM source genes and mTOR network components (C). A bootstrap procedure was used to calculate control connectivity scores represented by the Gaussian distributions.

