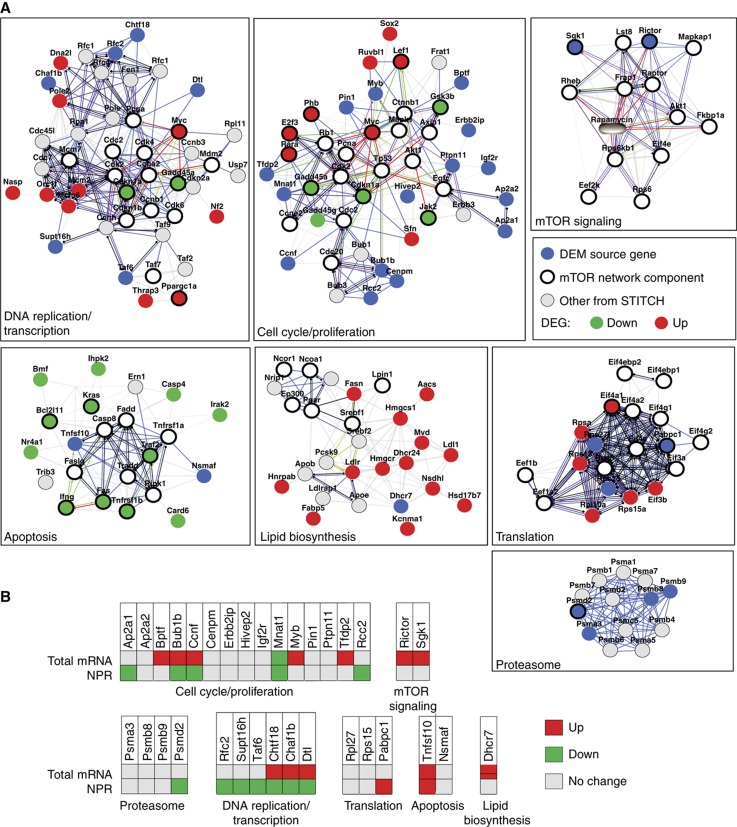
Figure 5.
DEM source genes are regulated at multiple layers within specific mTOR subnetworks. (A) The STITCH database (http://stitch.embl.de/) was used to generate a network from protein–protein interactions and functional associations involving identified DEM source genes, DEGs and mTOR network components. From the total network, subnetworks of DNA replication/transcription, cell cycle/proliferation, apoptosis, lipid biosynthesis, translation, proteasome and mTOR signaling were extracted. Legend for functional associations (edges) is depicted in Supplementary Figure S4. (B) EL4 cells were treated or not with rapamycin for 48 h. Total mRNA and NPR levels of the DEM source genes depicted in (A) were assessed by quantitative real-time PCR (see also Supplementary Table S6).

