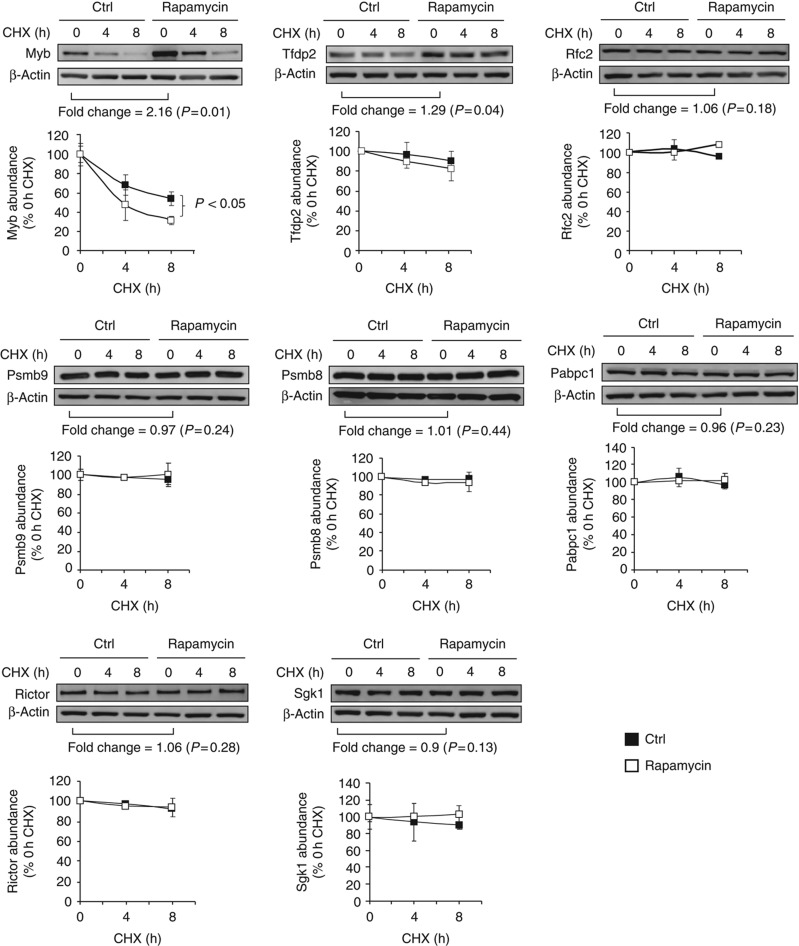
Figure 6.
Relative abundance and stability of eight DEM source proteins in the presence or absence of rapamycin. EL4 cells were treated or not (ctrl) with 20 ng/ml of rapamycin for 48 h. Levels of DEM source proteins were determined by western blotting and quantified by densitometry. Fold change indicates the rapamycin/ctrl protein abundance ratio. To estimate the half-life of DEM source proteins, cells were treated with cycloheximide (CHX) for 0, 4 and 8 h in the presence and absence of rapamycin. Results in the graphs are expressed as a percentage of the remaining protein abundance in CHX-treated cells relative to CHX-untreated cells. β-Actin served as a loading control. One representative western blot out of three is shown for individual proteins (P-value: Student's t-test). Source data is available for this figure in the Supplementry Information.

