Figure 2.
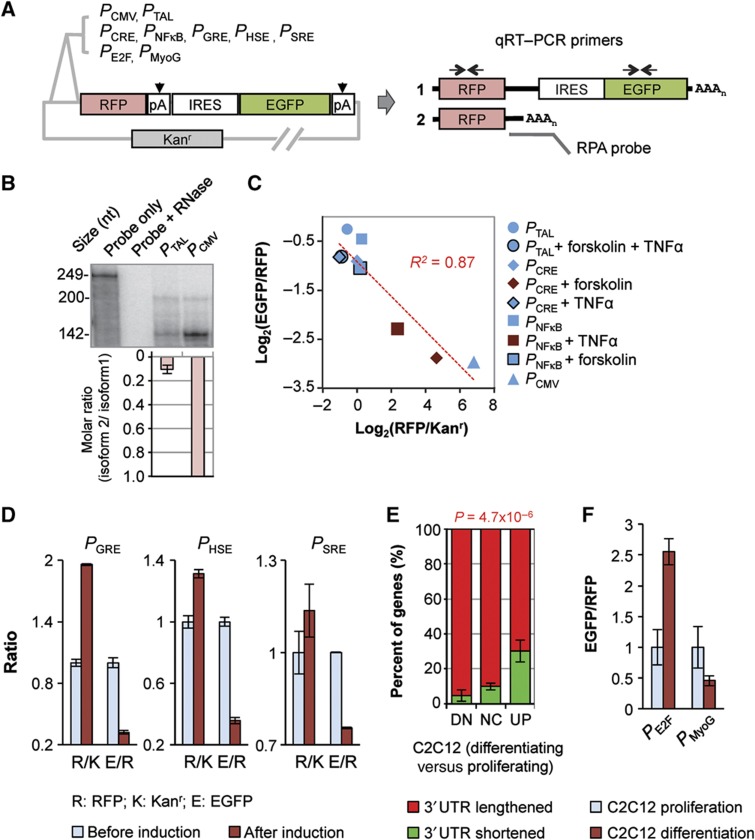
Reporter assays indicate regulation of polyA site choice by transcriptional activity. (A) Constructs used in this study. PCMV, PTAL, PCRE, PNFκB, PGRE, PHSE, PSRE, PE2F, and PMyoG are various promoters (see Materials and methods for details). RFP, IRES, EGFP, and Kanr are sequences encoding red fluorescent protein, internal ribosome entry site, enhanced green fluorescent protein, and kanamycin resistance gene, respectively. Kanr has its own promoter and polyA site. As shown in the graph, two polyA sites (pA) resulted in two transcript isoforms (1 and 2). Isoform 1 encodes RFP, IRES, and EGFP; and isoform 2 encodes RFP only. AAAn, poly(A) tail. qRT–PCR primers and RNase protection assay (RPA) probes are indicated in the graph, which were used to examine relative expression of the two isoforms. (B) RPA analysis of the isoforms expressed from the construct with PCMV or PTAL. Top, a representative autoradiograph of RPA results. The RPA probe is 249 nt in length. The 200-nt fragment corresponds to isoform 1 and the 142-nt fragment to isoform 2. The amount of sample loaded in each lane was adjusted to make the overall signal similar across samples. Bottom, normalized molar ratios of isoform 2 to isoform 1. The molar ratio of isoform 2 to isoform 1 was based on the amount of each RPA fragment quantified by PhosphorImager and the number of uracils in each fragment (UTP was used for probe labeling). The value for PCMV was set to 1, and error bars are standard deviation based on two experiments. (C) qRT–PCR analysis of expression level versus isoform ratio using cells transfected with constructs containing indicated promoters. Some of the transfected cells were treated with forskolin and/or TNFα as indicated in the graph. Expression level was measured by RFP/Kanr, and isoform ratio was measured by EGFP/RFP. R2 of linear regression is indicated. (D) qRT–PCR analysis of expression level and isoform ratio for constructs with PGRE, PHSE, and PSRE which were induced with dexamethasone, heat shock, and serum, respectively (see Materials and methods for details). R/K is RFP/Kanr and E/R is EGFP/RFP. Error bars are standard error of mean (s.e.m.) based on two experiments. (E) Percent of genes with 3′UTRs lengthened or shortened in three gene groups with different expression changes during differentiation of C2C12 cells. DN, downregulated; NC, no change; UP, upregulated. Error bars are standard deviation based on two samples; P-value is based on the Fisher's exact test comparing gene numbers in three groups. (F) qRT–PCR analysis of isoforms expressed from constructs with PE2F or PMyoG in proliferating and differentiating C2C12 cells. Isoform ratio was measured by EGFP/RFP. Error bars are standard error of mean (s.e.m.) based on two experiments. See Materials and methods for more technical details. Source data is available for this figure in the Supplementary Information.

