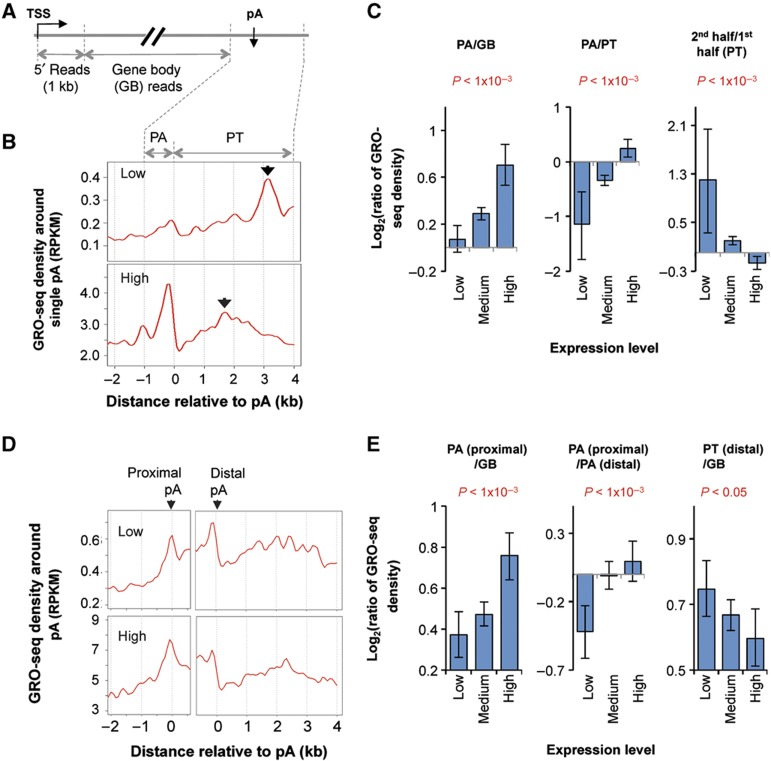
Figure 4.
Global nuclear run-on deep sequencing (GRO-seq) indicates that Pol II pausing at the polyA site is coupled to transcriptional activity. (A) Schematic of using GRO-seq data in this study. GRO-seq reads mapped to the sense strand of genes were divided into four groups: 5′ reads, polyA site region (PA) reads, gene body (GB) reads, and pre-termination (PT) reads (see Materials and methods for details). (B) GRO-seq read density in the 3′ end region of genes with a single polyA site. Read density was presented as reads per kilobase per million mapped reads, or RPKM. Expressed genes were divided into three groups based on expression level, that is, low, medium, and high. Only data for low and high groups are shown. Arrows in the figures indicate peaks in the PT region. (C) Ratio of GRO-seq read density between different regions for genes expressed at different levels. The comparing regions are indicated in each graph. Error bars are 90% confidence intervals and the P-values indicate difference between highly and lowly expressed genes (see Materials and methods for details). (D) GRO-seq read density around 5′-most (proximal) and 3′-most (distal) polyA sites in the 3′-most exon of lowly expressed genes (top) and highly expressed genes (bottom). (E) As in (C), ratio of GRO-seq read density between different regions for genes expressed at different levels. The comparing regions are indicated in each graph. Only the 200-nt upstream region of the polyA site was used for the PA (proximal)/PA (distal) plot.

