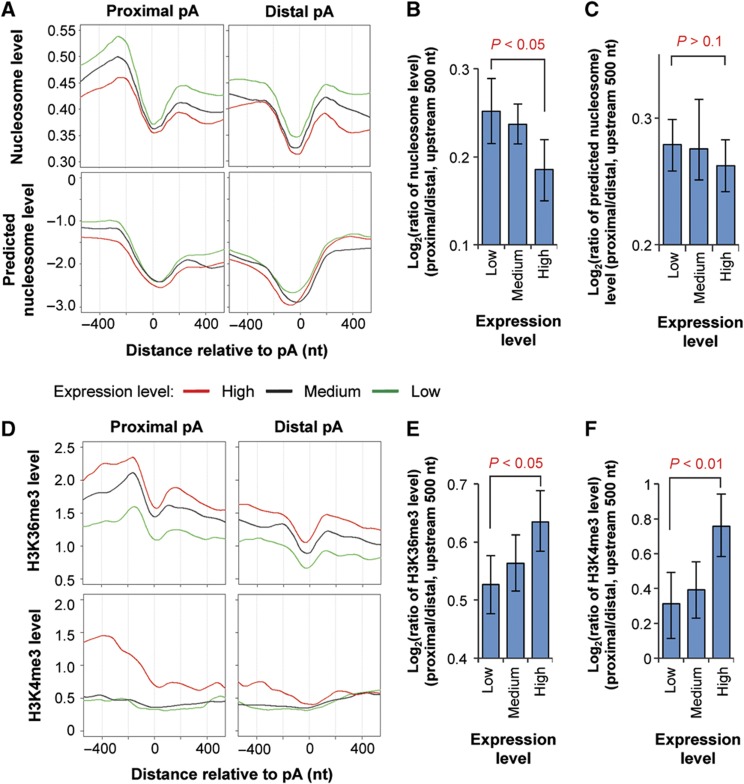
Figure 5.
Nucleosome positioning and histone modifications around alternative polyA sites in genes expressed at different levels. (A) Top, nucleosome levels around the proximal (left) and distal (right) polyA sites in genes expressed at different levels. Proximal and distal polyA sites are the 5′-most and 3′-most sites in the 3′-most exon, respectively. The nucleosome level was based on data from Schones et al (2008) using human resting T cells. Nucleosome level is the average number of reads mapped to a position relative to the polyA site normalized to the total mappable read number in the sample. Genes were divided into three groups based on expression level, that is, low, medium, and high, as indicated by different colored lines. Bottom, predicted nucleosome levels around proximal (left) and distal (right) polyA sites using the computational model reported by Kaplan et al (2009). (B) Ratio of nucleosome level in the 500-nt upstream region of proximal polyA site to that of distal site for genes expressed at different levels. (C) As in (B) except that predicted nucleosome levels were analyzed. Error bars are 90% confidence intervals and P-values indicate difference between highly and lowly expressed genes (see Materials and methods for details). (D) As in (A), expect that H3K36me3 (top) and H3K4me3 (bottom) levels around the proximal (left) and distal (right) polyA sites were plotted. H3K36me3 and H3K4me3 levels were based on data from Barski et al (2007) using human resting T cells. (E) As in (B), except that H3K36me3 levels were analyzed. (F) As in (B), except that H3K4me3 levels were analyzed. See also Supplementary Figure 5 for H3K36me1, H3K4me1, and H3K4me2 in resting T cells, and H3K36me3 and H3K4me3 in mouse embryonic fibroblasts and neuronal progenitor cells.

