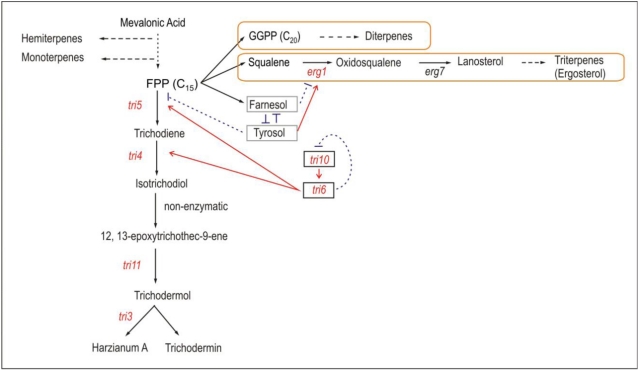
Figure 5.
Schematic representation of the model of regulation of the trichothecenes harzianum A and trichodermin biosynthesis. The synthesis of diterpenes and triterpenes is indicated by yellow squares. The genes indicated in red are those studied in the present work. tri6 and tri10 are regulatoy genes. Farnesol and tyrosol are two regulatory and antagonistic molecules. The red arrows indicated positive regulation. The blue doted lines indicate possible inhibitory activities (Modified from [12,27,28,29,30]).

