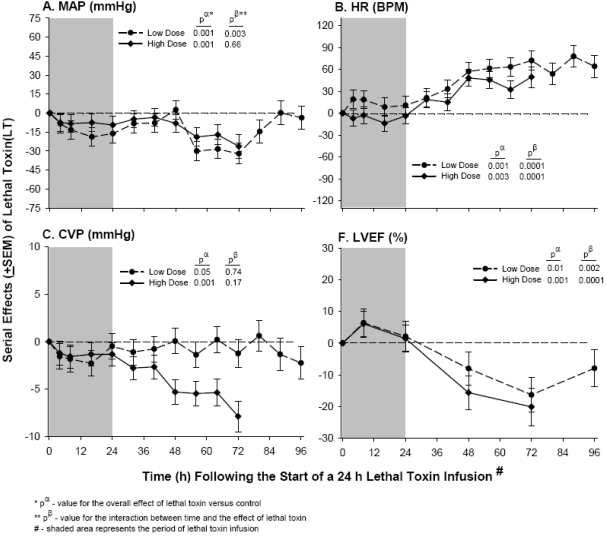
Figure 1.
Continuously sedated and mechanically ventilated canines with indwelling systemic and pulmonary arterial catheters were challenged with 24 h infusions of low or high doses of lethal toxin (LT) or diluent only (controls) [23]. Panels A through D show the serial mean (±SEM) effects compared to controls of the two doses of LT on changes from baseline for mean arterial blood pressure (MAP, mmHg), heart rate (HR, bpm), central venous pressure (CVP, mmHg), and left ventricular ejection fraction (LVEF, %). The shaded gray area denotes the 24 hour toxin infusion period. Increases or decreases with toxin compared to controls are denoted by symbols above or below the dashed horizontal no effect line, respectively. The p statistics are shown in each panel for the overall effect of toxin compared to control (pα) and the interaction between time and the effect of toxin (pβ). For statistical analysis serial changes from baseline with LT were compared to serial changes from baseline in controls. However, for clarity in this figure the serial effects of challenge (i.e., toxin minus control) are shown. Overall, MAP, CVP and LVEF decreased while HR increased with LT compared to controls.

