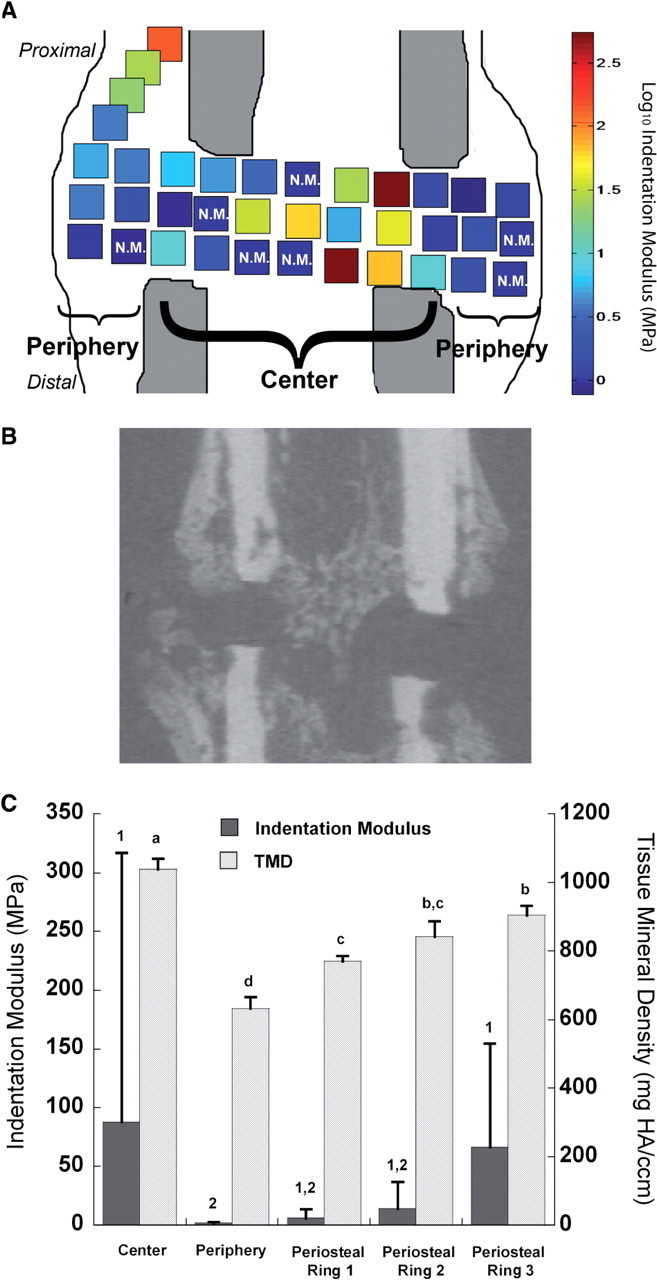
Fig. 3.

(A) Schematic of a representative section of a callus showing the spatial heterogeneity in indentation modulus across the callus. Higher modulus values were found within the center of the gap compared to lower moduli found in the periphery (P < 0.05). N.M. denotes nonmeasurable indents due to extremely high compliance of the tissue at those indent locations. (B) Approximately matched µCT cross-section to (A). (C) Indentation modulus and TMD for each of the five VOIs defined in Fig. 1. For indentation modulus, the height of each bar and of each error bar represents the mean and standard deviation, respectively, of all indents in the VOI for both calluses (e.g. n = 176 for the center of the gap). In contrast, each callus yields only one value of TMD for each VOI. Hence, for TMD, the height of each bar and of each error bar represent the mean and standard deviation, respectively, of the average TMD values of the two calluses (n = 2 for each VOI). Bars that are not labeled with the same number (indentation modulus) or letter (TMD) are significantly different from one another (P < 0.05).
